After installing real-time linux on both my Ubuntu laptops, my goal was to get a feel for how well latency peaks are eliminated compared to the standard Linux kernel. I was specificaly interested in network port latencies. Before looking at the network specific latenicies, I experimented with the internal worst-case interrupt latency of the kernel. The worst case latency for each hardware device will differ. The latencies of interrupts for devices connected directly to the CPU (e.g. local APIC) will be lower than the latencies of interrupts for devices connected to the CPU through a PCI bus. The interrupt latency for the APIC timer can be measured using "cyclictest". This should provide the lower-bound for interrupt latencies. Most likely, all other interrupts generated by other devices including the network card will exceed this value. The goal of running an RT kernel is to make the response time more consistent, even under load. I used hackbench to load the CPUs. You can see the effect on each processor by running htop:
hackbench -l 10000
htop
1 [|||||||||||||||||||||||||||||||||||||||||||||||||||||||||||||||||||||||||||||||||||||||||||98.1%]
2 [|||||||||||||||||||||||||||||||||||||||||||||||||||||||||||||||||||||||||||||||||||||||||||98.7%]
3 [|||||||||||||||||||||||||||||||||||||||||||||||||||||||||||||||||||||||||||||||||||||||||||98.7%]
4 [||||||||||||||||||||||||||||||||||||||||||||||||||||||||||||||||||||||||||||||||||||||||||100.0%]
5 [|||||||||||||||||||||||||||||||||||||||||||||||||||||||||||||||||||||||||||||||||||||||||||97.5%]
6 [|||||||||||||||||||||||||||||||||||||||||||||||||||||||||||||||||||||||||||||||||||||||||||97.5%]
7 [|||||||||||||||||||||||||||||||||||||||||||||||||||||||||||||||||||||||||||||||||||||||||||99.4%]
8 [||||||||||||||||||||||||||||||||||||||||||||||||||||||||||||||||||||||||||||||||||||||||||100.0%]
Mem[||||||||||||||||||||||||||||||||||||||||| 1036/7905MB]
Swp[ 0/16210MB]
PID USER PRI NI VIRT RES SHR S CPU% MEM% TIME+ Command
2843 dimitri 20 0 545M 75140 22716 S 4.0 0.9 1:21.71 /usr/bin/python /usr/bin/deluge-gtk
20586 dimitri 20 0 29500 2272 1344 R 3.0 0.0 0:00.91 htop
20896 root 20 0 6332 116 0 S 3.0 0.0 0:00.19 hackbench -l 10000
20884 root 20 0 6332 116 0 S 3.0 0.0 0:00.19 hackbench -l 10000
20969 root 20 0 6332 116 0 S 3.0 0.0 0:00.17 hackbench -l 10000
20885 root 20 0 6332 116 0 S 2.0 0.0 0:00.19 hackbench -l 10000
20895 root 20 0 6332 116 0 R 2.0 0.0 0:00.19 hackbench -l 10000
20883 root 20 0 6332 116 0 S 2.0 0.0 0:00.19 hackbench -l 10000
20891 root 20 0 6332 116 0 S 2.0 0.0 0:00.19 hackbench -l 10000
20682 root 20 0 6332 112 0 S 2.0 0.0 0:00.21 hackbench -l 10000
20715 root 20 0 6332 112 0 D 2.0 0.0 0:00.19 hackbench -l 10000
20887 root 20 0 6332 116 0 S 2.0 0.0 0:00.19 hackbench -l 10000
20911 root 20 0 6332 116 0 D 2.0 0.0 0:00.18 hackbench -l 10000
20880 root 20 0 6332 116 0 D 2.0 0.0 0:00.18 hackbench -l 10000
20881 root 20 0 6332 116 0 S 2.0 0.0 0:00.19 hackbench -l 10000
20882 root 20 0 6332 116 0 S 2.0 0.0 0:00.18 hackbench -l 10000
20888 root 20 0 6332 116 0 R 2.0 0.0 0:00.19 hackbench -l 10000
20889 root 20 0 6332 116 0 R 2.0 0.0 0:00.19 hackbench -l 10000
20890 root 20 0 6332 116 0 S 2.0 0.0 0:00.19 hackbench -l 10000
20892 root 20 0 6332 116 0 S 2.0 0.0 0:00.19 hackbench -l 10000
20894 root 20 0 6332 116 0 S 2.0 0.0 0:00.18 hackbench -l 10000
20897 root 20 0 6332 116 0 S 2.0 0.0 0:00.19 hackbench -l 10000
20898 root 20 0 6332 116 0 S 2.0 0.0 0:00.19 hackbench -l 10000
20912 root 20 0 6332 116 0 R 2.0 0.0 0:00.18 hackbench -l 10000
Hackbench ran all eight CPUs at near 100% and also caused lots of rescheduling interrupts. The scheduler tries to spread processor activity across as many cores as possible. When the scheduler decides to offload work from one core to another core, a rescheduling interrupt occurs. I also attempted to increase other device intrupts by running the bittorrent deluge client and rtsp/rtp internet radio. This generated both sound and wifi (ath9k) interrupts. Below, you can see a snapshot of the interrupt count for each device. The wifi (ath9k) is IRQ 17 and eth0 is on IRQ 56.
watch -n 1 cat /proc/interrupts
CPU0 CPU1 CPU2 CPU3 CPU4 CPU5 CPU6 CPU7
0: 144 0 0 0 0 0 0 0 IO-APIC-edge timer
1: 11 0 0 0 0 0 0 0 IO-APIC-edge i8042
8: 1 0 0 0 0 0 0 0 IO-APIC-edge rtc0
9: 399 0 0 0 0 0 0 0 IO-APIC-fasteoi acpi
12: 181 0 0 0 0 0 0 0 IO-APIC-edge i8042
16: 114 0 221 0 0 0 0 0 IO-APIC-fasteoi ehci_hcd:usb1, mei
17: 238921 0 0 0 0 0 0 0 IO-APIC-fasteoi ath9k
23: 113 0 10894 0 0 0 0 0 IO-APIC-fasteoi ehci_hcd:usb2
40: 0 0 0 0 0 0 0 0 PCI-MSI-edge PCIe PME
41: 0 0 0 0 0 0 0 0 PCI-MSI-edge PCIe PME
42: 0 0 0 0 0 0 0 0 PCI-MSI-edge PCIe PME
43: 0 0 0 0 0 0 0 0 PCI-MSI-edge PCIe PME
44: 0 0 0 0 0 0 0 0 PCI-MSI-edge PCIe PME
45: 0 0 0 0 0 0 0 0 PCI-MSI-edge xhci_hcd
46: 0 0 0 0 0 0 0 0 PCI-MSI-edge xhci_hcd
47: 0 0 0 0 0 0 0 0 PCI-MSI-edge xhci_hcd
48: 0 0 0 0 0 0 0 0 PCI-MSI-edge xhci_hcd
49: 0 0 0 0 0 0 0 0 PCI-MSI-edge xhci_hcd
50: 0 0 0 0 0 0 0 0 PCI-MSI-edge xhci_hcd
51: 0 0 0 0 0 0 0 0 PCI-MSI-edge xhci_hcd
52: 0 0 0 0 0 0 0 0 PCI-MSI-edge xhci_hcd
53: 32389 0 0 0 0 0 0 0 PCI-MSI-edge ahci
54: 195410 0 0 0 0 0 0 0 PCI-MSI-edge i915
55: 273 6 0 0 0 0 0 0 PCI-MSI-edge hda_intel
56: 2 0 0 0 0 0 0 0 PCI-MSI-edge eth0
NMI: 0 0 0 0 0 0 0 0 Non-maskable interrupts
LOC: 2592013 3074746 2470454 2448349 2525416 2454510 2440296 2424395 Local timer inter
SPU: 0 0 0 0 0 0 0 0 Spurious interrupts
PMI: 0 0 0 0 0 0 0 0 Performance monitoring interrupts
IWI: 0 0 0 0 0 0 0 0 IRQ work interrupts
RES: 357199 449954 390871 399211 536214 606334 493824 554138 Rescheduling interrupts
CAL: 300 467 500 505 480 484 477 476 Function call interrupts
TLB: 2876 647 582 632 1079 663 432 485 TLB shootdowns
TRM: 0 0 0 0 0 0 0 0 Thermal event interrupts
THR: 0 0 0 0 0 0 0 0 Threshold APIC interrupts
MCE: 0 0 0 0 0 0 0 0 Machine check exceptions
After loading the system, I ran cycletest at a very high real-time priority of 99:
On the Preempt-RT linux kernel:
sudo cyclictest -a 0 -t -n -p99
T: 0 ( 3005) P:99 I:1000 C: 140173 Min: 1 Act: 2 Avg: 9 Max: 173
T: 1 ( 3006) P:98 I:1500 C: 93449 Min: 1 Act: 4 Avg: 16 Max: 172
T: 2 ( 3007) P:97 I:2000 C: 70087 Min: 1 Act: 4 Avg: 17 Max: 182
T: 3 ( 3008) P:96 I:2500 C: 56069 Min: 2 Act: 13 Avg: 17 Max: 166
T: 4 ( 3009) P:95 I:3000 C: 46725 Min: 2 Act: 3 Avg: 17 Max: 174
T: 5 ( 3010) P:94 I:3500 C: 40050 Min: 2 Act: 10 Avg: 15 Max: 163
T: 6 ( 3011) P:93 I:4000 C: 35044 Min: 2 Act: 4 Avg: 20 Max: 169
T: 7 ( 3012) P:92 I:4500 C: 31150 Min: 2 Act: 13 Avg: 22 Max: 164
On a standard Linux kernel:
sudo cyclictest -a 0 -t -n -p99
T: 0 ( 4264) P:99 I:1000 C: 76400 Min: 3 Act: 5 Avg: 10 Max: 6079
T: 1 ( 4265) P:98 I:1500 C: 50934 Min: 2 Act: 6 Avg: 13 Max: 15501
T: 2 ( 4266) P:97 I:2000 C: 38201 Min: 3 Act: 6 Avg: 6 Max: 4685
T: 3 ( 4267) P:96 I:2500 C: 30561 Min: 3 Act: 5 Avg: 6 Max: 1735
T: 4 ( 4268) P:95 I:3000 C: 25467 Min: 3 Act: 5 Avg: 6 Max: 1288
T: 5 ( 4269) P:94 I:3500 C: 21829 Min: 3 Act: 7 Avg: 8 Max: 13301
T: 6 ( 4270) P:93 I:4000 C: 19101 Min: 3 Act: 6 Avg: 6 Max: 2192
T: 7 ( 4271) P:92 I:4500 C: 16978 Min: 4 Act: 5 Avg: 6 Max: 85
The maximum latenency for the standard linux kernel is as high as 15501 microseconds and depends on load. The maximum timer latency irrespective of load is between 150 and 185 microseconds for the Preempt-RT linux kernel. The averagae latency, however, is better on the standard linux kernel. This is to be expected as the main goal of the real-time kernel is determinism and performance may or may not suffer. I then connected my two laptops directly via a cross-over network cable and used a modified version of the zeromq performance tests to measure the round-trip latency of both the real-time and standard kernels. Both the sender and receiver test applications where run at a real-time priority of 85.
Sends 50000 packets (1 byte) and measures round-trip time:
sudo chrt -f 85 ./local_lat tcp://eth0:5555 1 50000
Receives packets and returns them to sender:
sudo chrt -f 85 ./remote_lat tcp://192.168.2.24:5555 1 50000
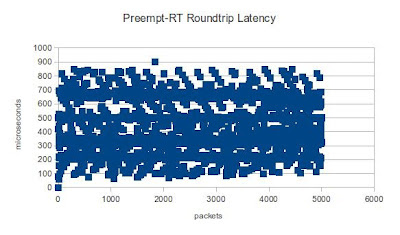
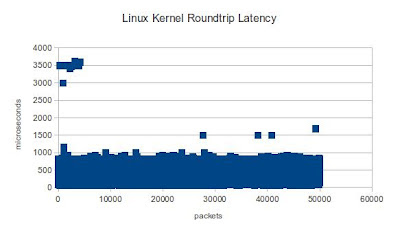
In the diagram below, you can see that the real-time kernel's maximum round-trip packet latencies never exceed 900 microseconds, even under high load. The standard kernel, however, suffered several peaks, some as high as 3500 microseconds.
 |
| Preempt-RT Round-trip Latency |
 |
| Standard Linux Kernel Round-trip Latency |
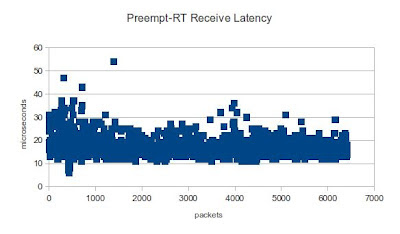
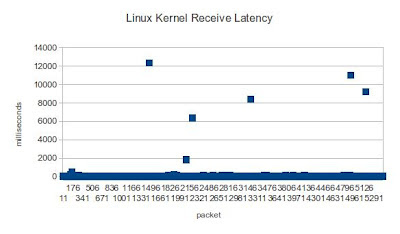
I then used ku-latency application to measure the amount of time it takes the Linux kernel to hand a received network packet off to user space. The real-time kernel never excceds 50 microsecods with an average of around 20 microseconds. The standard kernel, on the other hand, suffered some extreme peaks.
 |
| Preempt-RT Receive Latency |
 |
| Standard Linux Receive Latency |
For these experiments, I did not take into account CPU affinity. Different results could be achieved with CPU shielding -- something I might leave for another blog post.
References:
- Myths and Realities of Real-Time Linux Software Systems
- Red Hat Enterprise MRG 1.3 Realtime Tuning Guide
- Best practices for tuning system latency
- https://github.com/koppi/renoise-refcards/wiki/HOWTO-fine-tune-realtime-audio-settings-on-Ubuntu-11.10
- http://sickbits.networklabs.org/configuring-a-network-monitoring-system-sensor-w-pf_ring-on-ubuntu-server-11-04-part-1-interface-configuration/
- http://vilimpoc.org/research/ku-latency/
